


Human Factors study in Voice Interactive Systems
Voice interactive systems such as Amazon’s Alexa and Google Home are increasingly finding their way into people’s lives. The systems have shown advantages in a range of situations, particularly when parts of the user’s sensory or control systems are not available and when natural language interaction is preferred.
Gokul Prasath Rajamanickam, Yiyuan Jasmine Qin, Ramaa Venkatachari, and Anping Wang
- ABSTRACT
Voice interactive systems such as Amazon’s Alexa and Google Home are increasingly finding their way into people’s lives. The systems have shown advantages in a range of situations, particularly when parts of the user’s sensory or control systems are not available and when natural language interaction is preferred. Our objective is to study the use of such voice interaction systems in-home use setting and investigate whether the voice devices help to increase the efficiency of tasks, and it’s perceived difficulty and usefulness when compared to the control device (Phone). Twelve users participated in the human factors research and each user was given a set of five test tasks to be completed using a smart voice interaction device and five control tasks to be completed using a phone device. Based on our results, we found that users prefer using voice devices for simple ordering tasks (e.g. set alarm), but found it difficult when the task involves the user remembering the output response and input it back to the voice device for final output. Such tasks demand a high mental workload and led to a 42% failure in task completion objectives.
- INTRODUCTION
Speech has become a primary mode of input for communication with many automation systems such as Home Automation. Even though, Voice interactive systems such as IVR (interactive voice response) has existed for many years in the telephony, text or numerical input was the primary form of input rather than speech. Over the past decade, a combination of factors including increased computing power, growing availability of training data, and application of highly skilled resources have greatly improved speech recognition, which has, in turn, ushered in the beginning of a wave of voice interactive systems also called Intelligent personal assistants.
The voice interactive systems are machines or programs with voice recognition ability to receive and interpret dictation or to understand and carry out spoken commands [4]. Typical devices based on voice recognition include, but are not limited to Amazon’s Alexa, Google Voice Assistant, Apple’s Siri and Microsoft’s Cortana. As per the Forbes report [6], there are about 150 million devices sold and it is expected to grow at 48% annually.
These systems have shown advantage in a range of situations, including 1) when the user’s hands or eyes are busy; 2) when only a limited keyboard and/or screen is available; 3) when the user is disabled; and 4) when natural language interaction is preferred [3].
There is a wide range of human factors that come into play in designing effective and practical voice interactive systems, including:1) Perceiving/sensory: Can the user hear the information? 2) Information processing: Can the user comprehend the information from the system? 3) Acting/control: Can the user perform appropriate action based on the information? [4]. As per Karsenty [8], discoverability is often a challenge in voice interaction systems as the users have inaccurate mental models due to geographical locations and cultural influences. Some of the voice interface usability challenges include dialogue flow, feedback, and confirmation and error recovery [9].
Given the complexity of the systems, we focus our research on if voice interactive systems / intelligent personal assistants (hereinafter referred to as voice devices) improve efficiency or reduction in time needed for different task completion from interactions with smartphone devices (hereinafter referred to as phone devices). According to the technology acceptance model defined by David, 1989 [7], perceived usefulness and perceived ease of use are important factors in new technology adoption. Therefore, We also assess users’ experience of task completion in regards to perceived difficulty and satisfaction.
We propose three sets of hypotheses for each of the five tasks:
Hypothesis 1:
H10: Task completion time is the same for both voice device and phone device.
H1a: Task completion time is lower for voice devices when compared to the mobile platform.
Hypothesis 2:
H20: There is no difference in perceived task completion difficulty levels on voice and phone devices.
H2a: Perceived task completion difficulty levels are different on voice and phone devices.
Hypothesis 3:
H30: There is no difference in perceived task completion satisfaction levels between voice and phone devices.
H3a: Perceived task completion satisfaction levels are different on voice and phone devices.
- METHOD
Experiment Subject
The primary participants are students from MIT. We recruited 12 participants for the study who were given a questionnaire to gauge their awareness, usage, familiarity in using voice devices and willingness to participate in the study. Expert users i.e. users who currently use a voice control device on a daily basis for various tasks was excluded from the study.
Experiment Process
The experiment involved both qualitative and quantitative data collection. Each subject was provided with two sets of tasks: One control and One Test. The tasks are selected randomly from a set of two tasks. The control set used their mobile phones to complete the task as opposed to voice control devices in the test category. The following are the tasks used for the experiment:

Fig 3.1 Experiment process using Alexa and Smart Phone
- Checking the weather
- Setting timer
- Playing music
- Finding movie theaters
- Finding movie showtimes
The tasks were encoded in the form of the story and each user was provided with a script for both test and control tasks. The order and scripts that a participant receives for voice and mobile were randomized. The actual scripts used for the experiment are attached in Appendix 3. In our experiment, the voice-controlled device we provided is Alexa.
The tasks 1 to 5 are also set in increasing levels of difficulty. Based on the number of interactions and amount of information to be remembered for successful completion of tasks, we have categorized tasks 1-3 as tasks that have low mental workload, and tasks 4-5 as high mental workload.
In the experiment, the independent variable is:
- The tools participants utilized to finish the tasks(Alexa device/smartphone)
The dependent variables are:
- The time to complete the task
- Number of attempts participants made before finishing or giving up
- Whether participants finished each task.
We collected the following data:
| Data | Metric | Unit | Purpose |
| Task completion time | Duration | Seconds | To assess efficiency |
| Number of attempts | # of sets of operations# of verbal instructions (repetition/modification) | NA | To gauge learnability/Error Minimization |
| Satisfaction of output | Likert scale (1-5) | NA | Qualitative Analysis |
| Difficulty to complete the tasks | Likert scale (1-5) | NA | Qualitative Analysis |
| Preference of device for task completion | NA | NA | Qualitative Analysis |
For voice-controlled device experiments, we used another voice recording device to record the sound of both participants and voiced devices.
For the mobile platforms, we record the screen by screen recording applications that installed in the participants’ devices as well as built-in applications.
Data Processing
Efficiency:
We have a two-sample problem concerning the mean, with independent samples. We don’t know the standard deviation for both populations and n < 30. So, we would use a two-sample t-test. We are comparing values, so this is a one-sided hypothesis.
Thus, the hypothesis for each task is:
Null Hypothesis for H1: 𝜇1 − 𝜇2 = 0
Alternate Hypothesis for H1: 𝜇1 − 𝜇2 => 0
𝜇1: completion time of phone devices for the specific task
𝜇2: completion time of voice devices for the specific task
We will calculate the p-value and t- value for each task, and if the p-value is larger than the t-value, then the result is significant. Otherwise, the result is not significant.
Difficulty and Satisfaction
To assess perceived levels of task completion difficulty and satisfaction, we asked each participant to complete a survey at the end of a set of five tasks on either device. For each task, two multiple-choice questions on Likert scales of 1 to 5 were included:
- How easy was it to use the device? (1 = very easy and 5 = very difficult)
- How satisfied were you with the output? (1 = very unsatisfied and 5 = very satisfied)
At the end of the second set of tasks, participants were asked to identify their preference for voice or phone device for each task:
- If you had a choice, would you prefer to do this task with voice control devices or traditional search on your phone?
To assess the differences, one-tailed t-tests (paired two samples for means) were performed for each task. After completing the tasks and surveys, we asked each participant why they chose the particular device for the different tasks in a short interview.
4. RESULTS
4.1 Efficiency
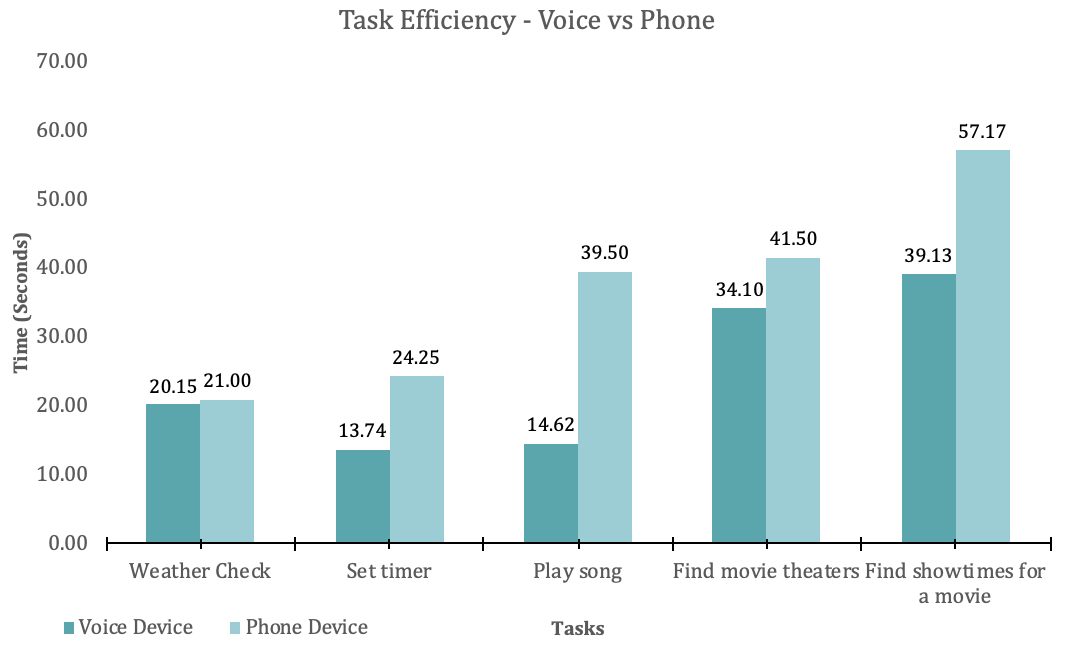
Figure 4.1 Task efficiency – Voice device vs. phone devices
Figure 4.1 shows the duration taken to complete the task (y-axis) during the Test for each task from 1 to 5 (x-axis) for the phone device task and the voice device task. Visual inspection suggests that using voice device did not perform the test faster for any tasks except for one, two and three.
We also used t-test to determine the significance of each task(table a2.1)
For Task 1, participants used voiced devices finished their task with a mean duration of 21.00 seconds (variance=269.27 seconds) while participants used phone devices finished their tasks with a mean duration of 15.13 seconds (variance=20.15 seconds). For the duration taken to complete Task 1, we performed a two-sample, one-sided independent t-test and found that the mean duration to complete the task of checking the weather, task completion time is the same for both voice devices and mobile devices. (t-value=0.22, p=.41, result not significant).
For Task 2, participants used voiced devices finished their task with a mean duration of 24.25 seconds (variance=212.93 seconds) while participants used phone devices finished their task with a mean duration of 9.20 seconds (variance=13.74 seconds). For the duration taken to complete Task 2, we performed a two-sample, one-sided independent t-test and found that the mean duration to complete the task of setting the timer, task completion time is shorter for voice devices than mobile devices. (t-value=2.16, p=.02, result significant).
For Task 3, participants used voiced devices finished their task with a mean duration of 39.250 seconds (variance=511.91 seconds) while participants used phone devices finished their task with a mean duration of 10.63 seconds (variance=14.62 seconds). For the duration taken to complete Task 3, we performed a two-sample, one-sided independent t-test and found that the mean duration to complete the task of finding the song, task completion time is shorter for voice devices than mobile devices. (t-value=3.64, p=.0007, result significant).
For Task 4, participants used voiced devices finished their task with a mean duration of 41.51 seconds (variance=1970.09 seconds) while participants used phone devices finished their task with a mean duration of 20.73 seconds (variance=34.10 seconds). For the duration taken to complete Task 4, we performed a two-sample, one-sided independent t-test and found that the mean duration to complete the task of checking the nearest cinema, task completion time is the same for both voice devices and mobile devices. (t-value=0.54, p=.30, result not significant).
For Task 5, participants used voiced devices finished their task with a mean duration of 57.17 seconds (variance=2536.88 seconds) while participants used phone devices finished their tasks with a mean duration of 23.94 seconds (variance=39.13 seconds). For the duration taken to complete Task 4, we performed a two-sample, one-sided independent t-test and found that the mean duration to complete the task of checking the showtime, task completion time is the same for both voice devices and mobile devices. (t-value=1.20, p=.12, result not significant).
Thus, we could know that task completion time is lower for voice devices than mobile platforms in setting timers and finding specific songs. For checking the weather, the nearest cinema and finding the showtime, there is no difference between voice devices and mobile platforms.
4.2 Difficulty and Satisfaction

Figure 4.2.1 Mean and linear trends on perceived levels of task completion difficulty on voice and phone devices on a Likert scale (1 = very easy and 5 = very difficult) (n = 12). Task 1 = weather check; task 2 = set timer; task 3 = play song; task 4 = find movie theaters; task 5 = find showtimes.
Figure 4.2.1 shows the difficulty to complete the task (y-axis) during the Test for each task from 1 to 5 (x-axis) for the phone device task and the voice device task. Visual inspection suggests that the difficulty of performing tasks using voice devices is lower only for task three.
For perceived levels of task completion difficulty, only for Task 5 (find movie showtimes), the null hypothesis was rejected (t-value=-3.03, p=.0056, result significant, Table a2.2). There is a positive correlation between increased task complexity and perceived level of difficulty on both voice and phone devices (Figure 4.2).

Figure 4.2.2 Mean and linear trends on perceived levels of task complete satisfaction on voice and phone devices on a Likert scale (1 = very unsatisfied and 5 = very satisfied) (n = 12). Task 1 = weather check; task 2 = set timer; task 3 = play song; task 4 = find movie theaters; task 5 = find showtimes.
Figure 4.2.2 shows the satisfaction to complete the task (y-axis) during the Test for each task from 1 to 5 (x-axis) for the phone device task and the voice device task. Visual inspection suggests that the difficulty of performing tasks using voice device is lower only for task three.
For perceived levels of task completion satisfaction, only for Task 4 (find movie theaters), the null hypothesis was rejected (alpha = 0.05) (Table a2.3). There is a negative correlation between increased task complexity and perceived level of satisfaction on voice devices (Figure 4.2.2).
4.3 Preferences
For the different tasks, users generally preferred simple tasks (Task 1, 2, and 3) with the voice device and complex tasks (Task 4 and 5) with phone devices (Table a2.4).
5. DISCUSSION
—under construction—
Include voice as an interface modal first, mental model and memory constraints highlight, Alexa help commands – training and help
Speech as an interface modality
In voice interfaces, spoken language is primarily the method of input and output. This means that users speak to interact with the system distinctly differentiating them from graphic user interfaces (GUIs). Voice interfaces are sequential, dynamic, given the nature of the spoken language, and transient. In contract GUIs are simultaneous (multiple sets of information can be presented to the user), static and permanent. This consequentially suggests that voice interfaces would be better suited for certain kinds of tasks while visuals displays like a smartphone or desktop would better serve some tasks. This was reflected in our experiment. Tasks such as finding the weather were completed with ease and on the first try, unlike tasks that required more imagination in terms of framing inputs. These included identifying theatres at a given location, finding out show timings for a movie, etc.
Usability
The attributes of usability are learnability, efficiency, error minimization, satisfaction, and memorability. For the scope of this study and taking into consideration time constraints, we focused on the first four attributes.
Learnability
How easy is it for users to accomplish basic tasks the first time they encounter the system?
At the grassroots level for a user to successfully learn how to use a system, it is important for the user to understand and appreciate its capabilities and limitations. Additionally, research shows that building on the user’s mental model[1][2] facilitates faster learning. Unlike traditional GUIs, voice user interfaces or VUI’s are inherently invisible. As a result voice systems rely on the user’s initiative to discover and learn. One way to overcome this by providing additional support. Devices Google Home has user onboarding through a mobile application during the initial setup but when it comes to specific tasks it relies on the user to either imagine possible commands for a task or recall past ones and modify them. Both of these add to the user’s cognitive load and rely on the user’s working memory. One way to enhance learnability in an unfamiliar system is by using signifiers[3]. In GUIs, these are typically seen in the form of features such as distinctive color for clickable text, or a question mark icon to seek more help. VUI’s currently use some forms of non-visual signifiers such as a sound when the device is activated or verbal signifiers such as acknowledgment [i] when a timer has been set. While these might help with learnability over time and help shape mental models (once users start associating sounds and responses with particular actions), our study showed that it affected efficiency. When users tried to perform a certain task and repeated commands they were often interrupted by signifiers affecting efficiency. Users often had to repeat the command from the beginning. In some cases, users also failed to register or recognize the signifier altogether.
Efficiency
Once users have learned the design, how quickly can they perform tasks?
Efficiency as an attribute to build usability can be seen as reducing the number of steps in a process to complete a task. From a voice design perspective, this is where the ambiguity comes it. Since speech is the only interface modal to provide input it is essentially the responsibility of the user to give the right command to complete a task efficiently. For example, in the study, one of the tasks was to find out which is the closest theatre to the participant. The most common command was, ‘Hey Alexa which is the closest theatre?’. This prompted the device to list a number of cinemas unceasingly. The serial presentation of such information places high demands on the user’s working memory and the result was that the user would often have to ask the device to repeat the first output or repeat the command with more specifics such as, ‘Hey Alexa what theatre is within 2 miles?’. This reiterates the above-mentioned conclusion that some tasks are better suited for devices with visual displays. We can also see from the figure 5.1 that the average failures for voice devices is also higher than phone devices in Task and Task 5. The time is taken for our participants to scan through a list of theatres on their phone and identify the closest one was less than the time taken to use a voice device to gather the same information.

Figure 5.1 task failures for voice devices and phone devices
Error minimization
How many errors do users make, how severe are these errors, and how easily can they recover from the errors?
To minimize errors when using a system it is important to help the users recognize, diagnose and recover from errors. The errors in VUIs can broadly be categorized into three kinds: recognition rejects, false accept and speech timeout. Recognition rejects are when the system is unable to complete the task but knows that it has failed. In such cases, the device normally provides a negative verbal output stating it can’t help or perform the required task. Under such a scenario it is up to the user to readjust their expectation or complete the task using an alternative system. In our study, this was commonly seen as the task complexity[4] increased and users grew frustrated with the device. This can also be a consequence of the user not being able to recognize the limitations or constraints of the system. False accepts are when the device incorrectly interprets the input and proceeds to complete the task without realizing the error. In such scenarios we often found the user interrupting the device and restarting with different or modified commands. This again adds to the users’ cognitive load. The speech timeout error is when the device doesn’t hear the command because the user is not within the device’s range, when the user takes too long between commands or when the user forgets to start the command with the device’s name. During our study, we witnessed all three of these errors. (more specifics on how to minimize?)
Satisfaction
How pleasant is it to use the system?
System satisfaction is a key attribute to ensure that users repeatedly use the system and continue to explore features and new applications for it. Based on our experiment we found that as task complexity increased satisfaction decreased. As task complexity increased the users found that they had to be extremely specific in order to elicit a satisfactory output. There was no room for ambiguity. More support for complex tasks and increasing efficiency can increase satisfaction for new users in particular.
Limitations and Constraints of our Methodology
Our experiment and discussion were primarily based on five tasks assigned in increasing levels of complexity. While these are representative of some of the most common tasks performed in the context of home use, they are by no means illustrative of the wide range of tasks that can be completed using voice interaction devices today. The limited sample size also places a constraint on the generalization of the results. Additionally, we also did not take into consideration factors such as lexis, syntax, and pronunciation all of which could have contributed to our outcomes. Our study involved the voice-only device, but there are voice devices with visual displays that are currently available in the market. Our conclusions might not be applicable to such devices as the addition of visual feedback can change the efficiency, perceived difficulty, and satisfaction for some tasks.
[1]
[2] A mental model is a representation of something in the real world and how it is done from the user’s perspective.
[3] A ‘signifier’ is some sort of indicator or signal of what an object does.
[4] In this study task complexity is defined as those that rely on working memory and high cognitive load.
[i] Verbal signifiers of various devices can be found in the appendix.
[1] A mental model is a representation of something in the real world and how it is done from the user’s perspective.
[2] A ‘signifier’ is some sort of indicator or signal of what an object does.
[i] Verbal signifiers of various devices can be found in the appendix.
CONCLUSION
Our study analyzed the use of both voice-only and visual display devices in home-use settings for task completion. We also used the Likert scale to evaluate overall satisfaction and preferences between devices. We found that users preferred visual displays to voice-only devices as the complexity of tasks increased. Factors such as the user’s mental model and cognitive load contributed to this preference.
We also identified several factors that can have implications on the design of future voice interactive devices. While speech as an input modality is often assumed to be the preferred choice of input, we found that users often have to be singularly articulate and thoughtful in their interactions with the device. This is uncharacteristic of natural human to human interactions and often did not come instinctively to the new users who participated in our study. While voice-only devices hold great potential to transform how we complete day to day tasks, their success begins with discoverability, can continue with efficiency and grow with satisfaction.
REFERENCES
- https://link-springer-com.libproxy.mit.edu/content/pdf/10.1007%2F978-0-387-68439-0.pdf
- https://journals-sagepub-com.libproxy.mit.edu/doi/pdf/10.1177/1541931218621231
- Cohen, Philip R., and Sharon L. Oviatt. 1994. “The Role of Voice in Human-Machine Communication.” https://www.nap.edu/read/2308/chapter/6.
- Gardner-Bonneau, Daryle, and Harry E. Blanchard, eds. 2007. Human Factors and Voice Interactive Systems. 2nd edition. New York: Springer.
- Proctor, Robert W., and Trisha Van Zandt. 2017. Human Factors in Simple and Complex Systems, Third Edition. 3rd ed. Boca Raton, FL, USA: CRC Press, Inc.
- Koetsier, John. 2018. Amazon Echo, Google Home Installed Base Hits 50 Million; Apple Has 6% Market Share, Report Says. Forbes. Available from: https://www.forbes.com/sites/johnkoetsier/2018/08/02/amazon-echo-google-home-installed-base-hits-50-million-apple-has-6-market-share-report-says/#3432da85769c
- Davis F.D. 1989. Perceived usefulness, perceived ease of use and user acceptance of information technology. MIS Quart. , 13, 319–339.
- Laurent Karsenty. 2002. Shifting the Design Philosophy of Spoken Natural Language Dialogue: International Journal of Speech Technology 5, 2: 147–157.
- Kamm C. 1995. User interfaces for voice applications. Proc. Natl Acad. Sci. USA, 92, 10031–10037.
APPENDIX 1 – Process of Calculation
As the process for all the t-test calculations mentioned in the paper is the same, we only stated the process for verifying task one of the hypotheses one.
In the following section, we analyze the hypothesis one first.
As we mentioned before, the hypothesis for H0 is as follows:
Null Hypothesis for H0: 𝜇1 − 𝜇2 = 0
Alternate Hypothesis for H0: 𝜇1 − 𝜇2 ≠ 0
𝜇1: task completion time for smartphone
𝜇2: task completion time for voice-controlled devices
Data analysis for task one weather checking:
| Treatment 1 (Phone) | Diff (X – M) | Sq. Diff (X – M)2 |
| 10 | -11 | 121 |
| 33 | 12 | 144 |
| 29 | 8 | 64 |
| 20 | -1 | 1 |
| 7 | -14 | 196 |
| 23 | 2 | 4 |
| 16 | -5 | 25 |
| 25 | 4 | 16 |
| 22 | 1 | 1 |
| 31 | 10 | 100 |
| 24 | 3 | 9 |
| 12 | -9 | 81 |
| M: 21.00 | SS: 762.00 |
Table a1.1 Data analysis for the efficiency of task one, phone device
| Treatment 2 (Alexa) | Diff (X – M) | Sq. Diff (X – M)2 |
| 19.81 | -0.34 | 0.11 |
| 18.77 | -1.38 | 1.9 |
| 31.11 | 10.96 | 120.16 |
| 10.12 | -10.03 | 100.57 |
| 15.18 | -4.97 | 24.68 |
| 8.73 | -11.42 | 130.38 |
| 10.53 | -9.62 | 92.51 |
| 36.53 | 16.38 | 268.36 |
| 17 | -3.15 | 9.91 |
| 25 | 4.85 | 23.54 |
| 37.82 | 17.67 | 312.29 |
| 11.18 | -8.97 | 80.43 |
| M: 20.15 | SS: 1164.84 |
Table a1.2 Data analysis for the efficiency of task one, voiced device
Then we calculate the scores by following methods:
Treatment 1
N1: 12
df1 = N – 1 = 12 – 1 = 11
M1: 21
SS1: 762
s21 = SS1/(N – 1) = 762/(12-1) = 69.27
Treatment 2
N2: 12
df2 = N – 1 = 12 – 1 = 11
M2: 20.15
SS2: 1164.84
s22 = SS2/(N – 1) = 1164.84/(12-1) = 105.89
T-value Calculation
s2p = ((df1/(df1 + df2)) * s21) + ((df2/(df2 + df2)) * s22) = ((11/22) * 69.27) + ((11/22) * 105.89) = 87.58
s2M1 = s2p/N1 = 87.58/12 = 7.3
s2M2 = s2p/N2 = 87.58/12 = 7.3
t =M1 – M2S2M1 + S2M2 =0.8514.6= 0.22
The t-value is 0.22. We could know that the according p-value is 0.825661.
Thus the result is not significant at p < .05.
Appendix2 – Detailed Calculation Results
Following are the detailed calculation results
Table a2.1 Calculation result for the time of task completion on voice and phone devices
| Task 1 | Task 2 | Task 3 | Task 4 | Task 5 | |
| Meanvoice | 21.00 | 24.25 | 39.50 | 41.50 | 57.17 |
| Variancevoice | 69.27 | 212.93 | 511.91 | 1970.09 | 2536.88 |
| Meanphone | 15.13 | 9.20 | 10.63 | 20.73 | 23.94 |
| Variancephone | 20.15 | 13.74 | 14.62 | 34.10 | 39.13 |
| t stat | 0.22 | 2.16 | 3.64 | 0.54 | 1.20 |
| P(T<=t) one-tail | 0.41 | 0.02* | 0.0007* | 0.30 | 0.12 |
| t Critical one-tail | 1.80 | 1.80 | 1.80 | 1.80 | 1.80 |
| Significant? | No | Yes | Yes | No | No |
*p < 0.05
Table a2.2 Participants’ perceived levels of task completion difficulty on voice and phone devices on a likert scale (1 = very easy and 5 = very difficult) (n = 12, df = 11). A T-test paired two sample for means was performed (alpha = 0.05). Task 1 = weather check; task 2 = set timer; task 3 = play song; task 4 = find movie theaters; task 5 = find showtimes.
| Task 1 | Task 2 | Task 3 | Task 4 | Task 5 | |
| Meanvoice | 1.83 | 1.58 | 1.83 | 2.67 | 3.00 |
| Variancevoice | 1.79 | 0.99 | 1.97 | 2.06 | 2.55 |
| Meanphone | 1.33 | 1.33 | 2.17 | 1.92 | 1.58 |
| Variancephone | 0.79 | 0.79 | 1.78 | 1.72 | 0.81 |
| t stat | -1.39 | -0.90 | 1.17 | -1.57 | -3.03 |
| P(T<=t) one-tail | 0.096 | 0.19 | 0.13 | 0.073 | 0.0056* |
| t Critical one-tail | 1.80 | 1.80 | 1.80 | 1.80 | 1.80 |
*p < 0.05
Table a2.3. Participants’ perceived levels of task complete satisfaction on voice and phone devices on a Likert scale (1 = very unsatisfied and 5 = very satisfied) (n = 12). A T-test paired two samples for means was performed (alpha = 0.05). Task 1 = weather check; task 2 = set timer; task 3 = play song; task 4 = find movie theaters; task 5 = find showtimes.
| Task 1 | Task 2 | Task 3 | Task 4 | Task 5 | |
| Meanvoice | 4 | 3.75 | 3.58 | 3.083 | 3.42 |
| Variancevoice | 1.82 | 2.39 | 2.27 | 1.72 | 2.45 |
| Meanphone | 4.083 | 4.42 | 3.67 | 4.083 | 4.17 |
| Variancephone | 1.90 | 0.81 | 2.42 | 2.27 | 1.79 |
| T stat | 0.23 | 1.77 | 0.14 | 1.82 | 1.33 |
| P(T<=t) one-tail | 0.41 | 0.052 | 0.44 | 0.048* | 0.11 |
| t Critical one-tail | 1.80 | 1.80 | 1.80 | 1.80 | 1.80 |
*p < 0.05
Table a2.4. Number of participants that prefer voice or phone device with a given task (n =11). Task 1 = weather check; task 2 = set timer; task 3 = play song; task 4 = find movie theaters; task 5 = find showtimes.
| Task 1 | Task 2 | Task 3 | Task 4 | Task 5 | |
| Voice | 5 | 8 | 7 | 0 | 2 |
| Phone | 6 | 3 | 4 | 11 | 9 |
Appendix 3:
Script Alexa:
Hi.
Thank you for agreeing to participate in our study. At this point, you should have read and signed the consent form. If you have any more questions before we start the study do take a minute and talk to us before reading through the tasks below.
————-
We have outlined a list of tasks for you to complete below. To aid you in task completion feel free to use the Alexa as and when you see necessary. You can take as much time and attempts as needed to complete the task to your satisfaction. There is no right or wrong way to complete tasks. We will not be able to assist you in any way with task completion. If you find yourself stuck at any point you can come back to it later or continue with the rest of the tasks. Save any comments, feedback or questions until you’ve completed the tasks. You will be asked to fill out a survey at the end of this. If you’re ready continue reading…
————-
It’s a beautiful fall weekend. You wake up early and decide to go for a walk. You need to know whether you will need an umbrella before you leave the house. (Task 1)
As you look for your umbrella you decide to make yourself a cup of tea. You need to brew the tea for exactly 3 minutes. You need to keep track of the time. (Task 2)
While you wait for your tea to brew, you decide to listen to Taylor Swift. (Task 3)
You’re now back from your walk and feel like watching a movie. You’re not sure if there is a cinema near you. (Task 4)
You decide to go watch Last Christmas and wonder if and when it shows near your house. (Task 5)
————-
Thank you for completing the tasks!
Script Phone:
Hi.
Thank you for agreeing to participate in our study. At this point, you should have read and signed the consent form. If you have any more questions before we start the study do take a minute and talk to us before reading through the tasks below.
————-
We have outlined a list of tasks for you to complete below. To aid you in task completion feel free to use your phone as and when you see necessary. You can take as much time and attempts as needed to complete the task to your satisfaction. There is no right or wrong way to complete tasks. We will not be able to assist you in any way with task completion. If you find yourself stuck at any point you can come back to it later or continue with the rest of the tasks. Save any comments, feedback or questions until you’ve completed the tasks. You will be asked to fill out a survey at the end of this. If you’re ready continue reading…
————-
It’s a beautiful fall weekend. You wake up early and decide to go for a walk. You need to know whether you will need an umbrella before you leave the house. (Task 1)
As you look for your umbrella you decide to make yourself a cup of tea. You need to brew the tea for exactly 3 minutes. You need to keep track of the time. (Task 2)
While you wait for your tea to brew, you decide to listen to Taylor Swift. (Task 3)
You’re now back from your walk and feel like watching a movie. You’re not sure if there is a cinema near you. (Task 4)
You decide to go watch Last Christmas and wonder if and when it shows near your house. (Task 5)
————-
Thank you for completing the tasks!